Chi square test hypothesis
Chi – square Test:-
· The results of the data obtained from the tests differ slightly from the expected results.
· The chi square test is helpful in finding out the degree of discrepancy between the obtained and expected data.
· A chi-square test is a statistical method used to determine whether different classes of data obtained from a test are in a correct expected ratio or not.
· Number of Observations:- It can range from 5 to 50. The greater the number of observations, the more correct conclusions are obtained.
· Formula:-
.bmp)
· Table Value of Chi square:- The calculated chi square value is compared with the chi square value in the table to get the result. The table value of a chi square depends on 2 factors –
i. Degree of freedom:-
.bmp)
ii. Significance:- Find the value of the chi square in front of the degree of freedom against the probability level 0.05.
Ø If the calculated value is less than the table value, it means that the deviation is not significant. The data obtained are in the expected ratio. The deviation is just a coincidence or is due to the environment.
Ø If the calculated value is greater than the table value, it means that the deviation is significant. The data obtained are not in the expected ratio. The deviation is due to genetic factors.
· Chi – square table:-

· P0.05:- In 5% of experiments, the calculated chi square value may be more than the table value by coincidence. If this happens in more than 5% of the experiments, then the deviation is not a coincidence but due to some other reason.
· Null Hypothesis:- In the chi square test, it is first assumed that the data obtained are in the expected ratio and the deviation is just coincidence or is due to the environment.
Ø Now if the calculated value is less than the table value, then the null hypothesis is true.
Ø And if the calculated value is more than the table value, then the null hypothesis is false.
Q.1. By crossing a tall pea plant with a dwarf plant, all the plants of F1 progeny were tall but in the F2 generation 787 tall and 277 dwarf plants were obtained. Do the chi-square test of the given data.
.bmp)
.bmp)

.bmp)
On seeing the table value of the chi square against the degree of freedom 1 at the P0.05 probability level in the table:-
.bmp)
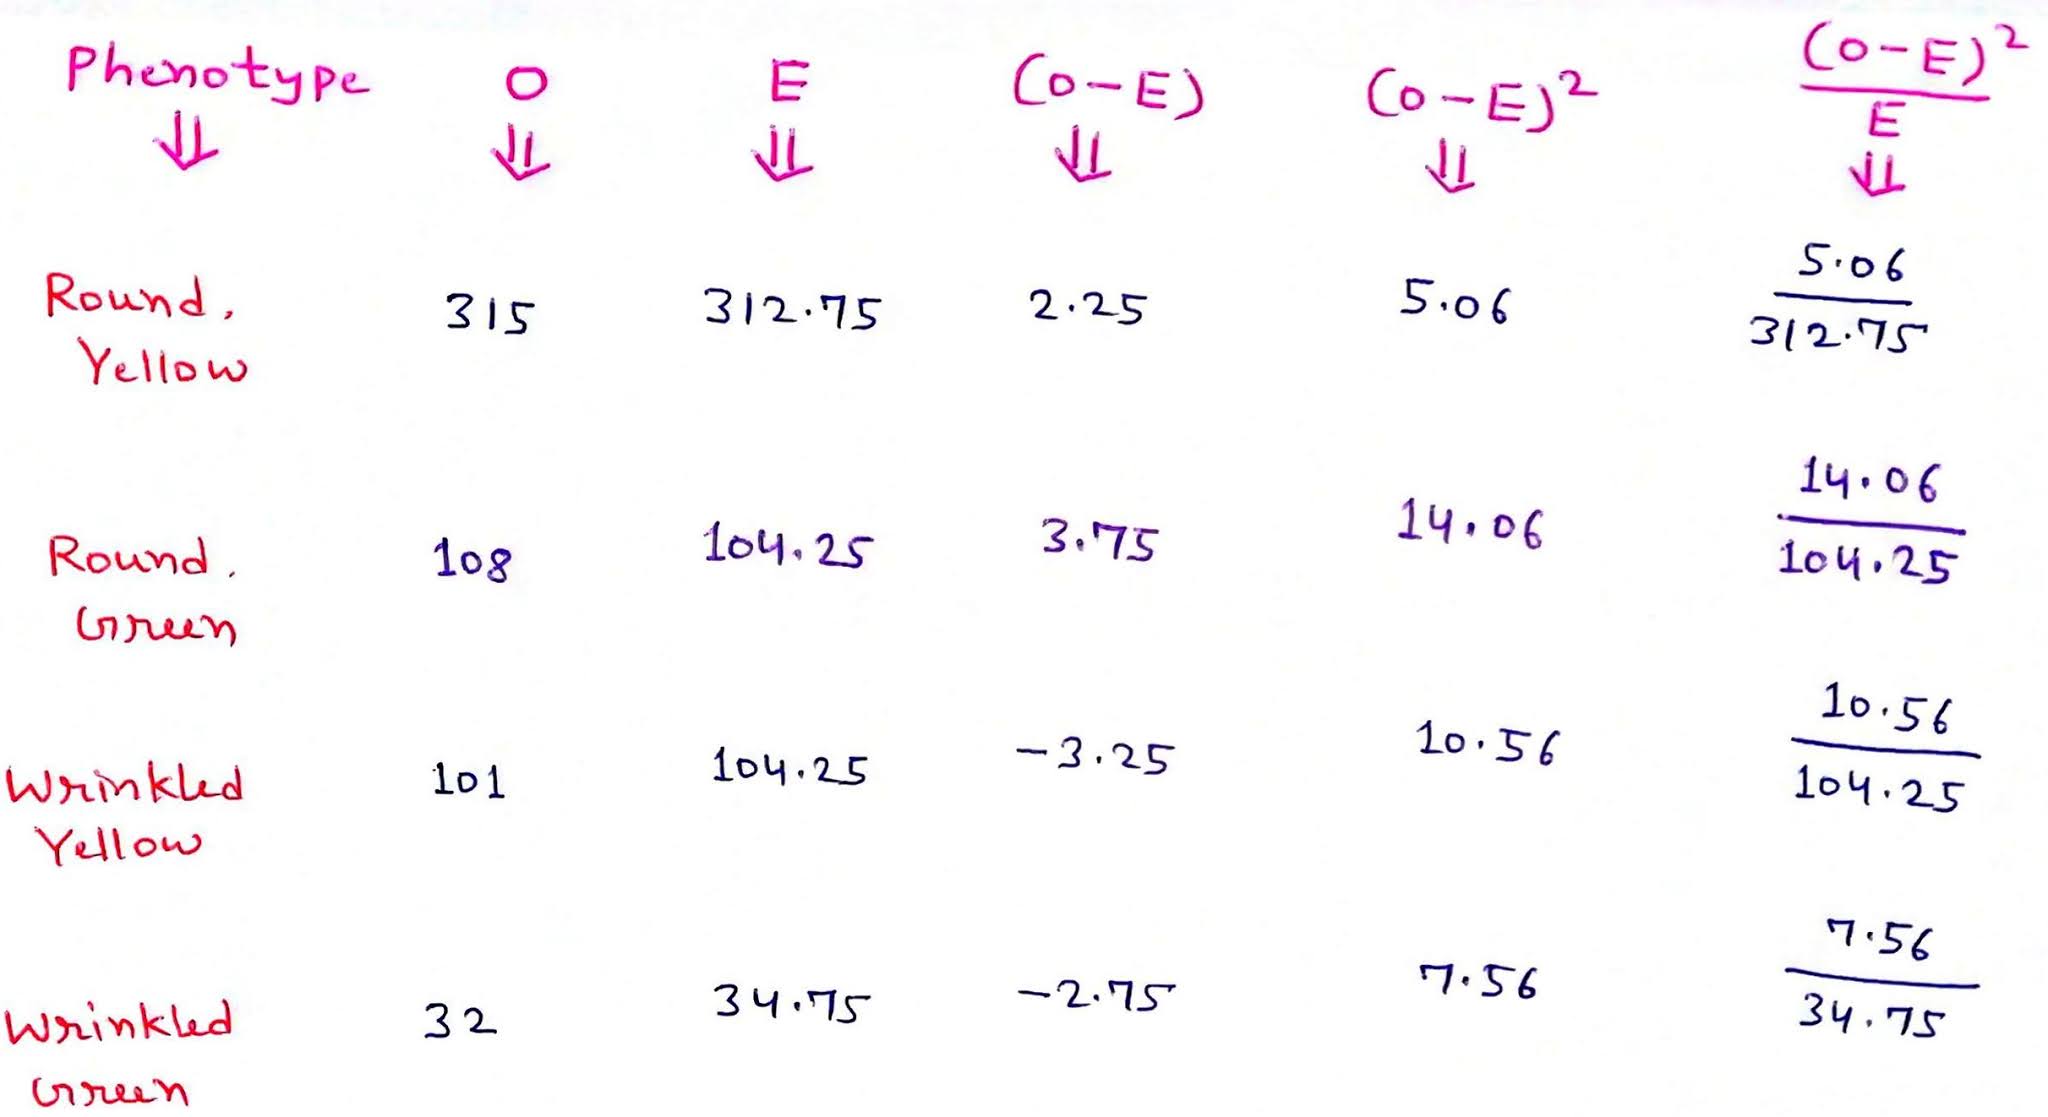
Q.2. In peas, when a round yellow seeded species was crossed with a wrinkled green seeded species, all plants in the F1 generation were with round yellow seeds. But the following data were obtained in the F2 generation –
.bmp)
Do the chi-square test of the given data.
.bmp)
.bmp)
On seeing the table value of the chi square against the degree of freedom 3 at the P0.05 probability level in the table:-
.bmp)